
Colorer chaque région
L'intensité de la couleur porte la valeur. Le bon choix pour les taux, les parts et les données par habitant, déjà ajustés à la taille ou à la population.
Ouvrir le modèleA blank Georgia county map to print, and a builder to fill it with your own data. Download the free outline of all 159 counties, or upload a spreadsheet and publish an interactive Georgia map you can embed anywhere.
Les 159 counties, en tracé net. Imprimez-le, coloriez-le ou insérez-le dans un document — sans compte et sans attribution.
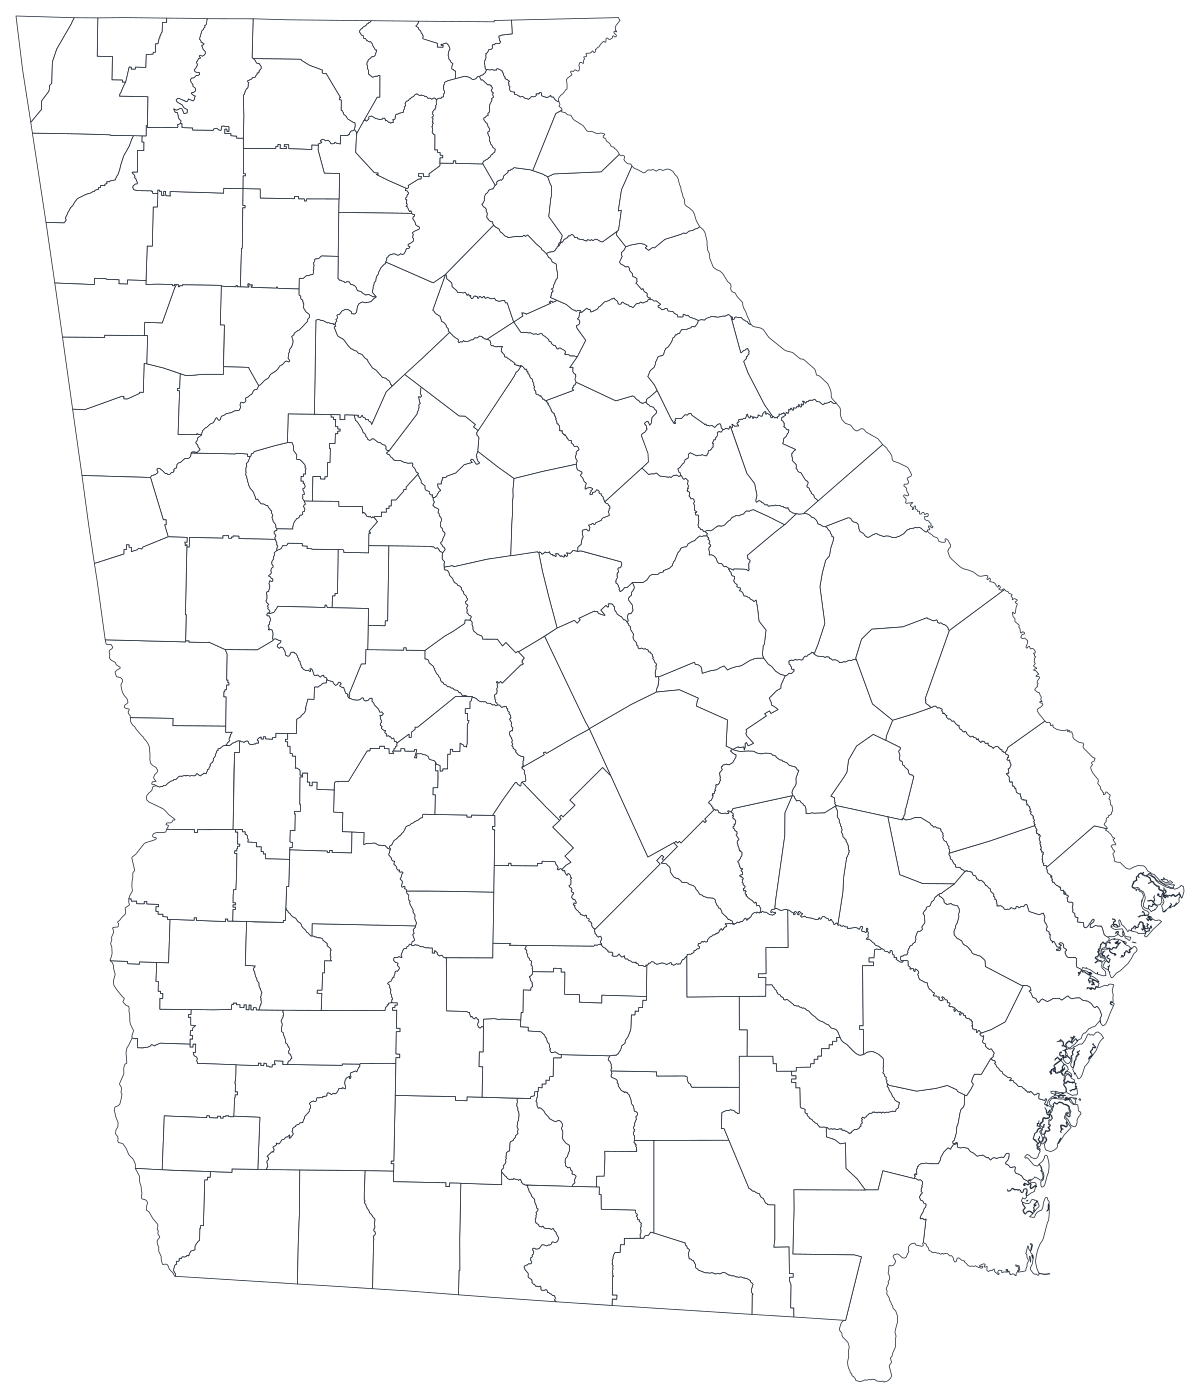
Libre pour tout usage, y compris commercial et scolaire. Généré à partir des mêmes contours que l'éditeur.
Télécharger le SVGGeorgia has 159 counties — more than any state except Texas, and a legacy of the era when a county was meant to be a day's ride from end to end and every one of them carried weight in state politics. The result is a map with unusually fine resolution and unusually uneven contents. Metro Atlanta's millions sit in a tight knot of small shapes in the north — Fulton, Gwinnett, Cobb, DeKalb, Clayton and the ring beyond them — while more than a hundred counties across middle and south Georgia are rural, and dozens have fewer than 10,000 residents. Taliaferro County has around 1,500 people; Fulton has over a million. That gap is the first thing to design around: on a Georgia county map, area and population point in opposite directions, and the eye reads area.
Colorez les régions pour un taux, dimensionnez un marqueur pour un effectif. Inverser les deux est la façon la plus courante de tromper le lecteur.
L'intensité de la couleur porte la valeur. Le bon choix pour les taux, les parts et les données par habitant, déjà ajustés à la taille ou à la population.
Ouvrir le modèleUn symbole par région, mis à l'échelle selon la valeur. À utiliser pour les effectifs et les totaux, là où colorer la surface ne ferait que redessiner la carte de la population.
Ouvrir le modèleDes cercles dimensionnés par la valeur, posés sur le tracé. Efficace quand quelques régions dominent et que les petites disparaîtraient dans un aplat.
Ouvrir le modèleDepartment of Public Health indicators through OASIS, Department of Labor employment figures, Department of Education enrolment, and Secretary of State election returns are all published by county.
Uninsured rate, turnout, poverty rate, share of households with broadband. Rates are already adjusted for population, which is what shading a region needs.
Georgia's clearest divide is geographic: the Atlanta commuter counties, the fall-line cities, and the rural south. Ranked lists hide that pattern; a map states it.
Classroom exercises, territory planning, colour-by-hand worksheets. The free outline above prints cleanly at any size and holds all 159 boundaries.
Shade by a raw count and you have drawn metro Atlanta, whatever the measure was. Use symbols or bubbles sized by the count instead.
With 159 shapes to fill, a handful of counties with data leaves an almost entirely grey map. Rank what you have, or aggregate to the twelve state service regions.
Georgia has both county and city school systems, and Atlanta alone spans Fulton and DeKalb. Several counties — Athens-Clarke, Augusta-Richmond, Columbus-Muscogee and Macon-Bibb — are consolidated with their city, and most are not.
If the point is how Georgia sits against Florida, Alabama or the South as a whole, use the US county map so the reader can see across the state line.
Du tableur à la carte publiée, étape par étape.
The free outline above is a plain SVG of all 159 counties — print it, or drop it into a document. To build with data, open the PlotSet Georgia (counties) template, which loads with sample data already bound.
One row per county: the county name or its five-digit FIPS code in the first column, your number in the second. Georgia FIPS codes all begin 13.
Import a CSV or Excel file, paste from a spreadsheet, or connect a Google Sheet so the map can be refreshed when the source updates.
Shade the counties for a rate, or switch to symbols or bubbles for a count. With 159 counties, sized markers also solve the problem of a big empty county outweighing a crowded small one.
At this resolution most shapes are small. Four or five clearly separated steps are readable; a smooth gradient across 159 counties turns into texture.
Publish for a live interactive map with a tooltip on every county — the practical way to name 159 shapes — or export a PNG, SVG or PDF.
Partez du modèle Georgia avec ses données d'exemple, puis remplacez-les par les vôtres.
Ouvrir le modèleÀ quoi doit ressembler la colonne des lieux, et où trouver des données déjà compatibles.
The Census writes DeKalb, McDuffie and McIntosh; the boundaries behind this map write De Kalb, Mc Duffie and Mc Intosh. Same counties, different strings, and a name join drops whichever form your file does not use.
13001 is Appling, 13321 is Worth. The county part is odd-numbered rather than sequential, so do not try to derive it. Store the column as text so the codes keep their shape.
Jackson, Jefferson, Johnson, Madison, Monroe, Union and Washington are all Georgia counties and all common elsewhere. If your source is national, filter to state FIPS 13 before you join.
The Department of Public Health's OASIS system, the Georgia Department of Labor, the Department of Education and the Secretary of State all publish county tables, as does the Census Bureau's American Community Survey.
It produces a population map every time. Anything that grows simply because more people live there should be a sized symbol, not a shade.
159 labels will not fit at any size a reader will actually look at. Label the dozen that carry the argument and leave the rest to the tooltip.
Ware County is the largest on the page and holds about 35,000 people; Clayton is a fraction of the size with about eight times as many. Say so in the caption, or pair the map with a bar chart.
A county of 1,500 people can swing from best to worst in the state on a handful of cases. Suppress or flag small denominators rather than letting them set the colour scale.
A sequence of hues has no natural order, so readers cannot tell high from low without checking the legend on every county. Use one hue, light to dark.
Yes. The outline above is a free SVG of all 159 Georgia counties — right-click to save it, print it, or drop it into a worksheet or document. No account needed.
Importez un tableur et publiez une carte interactive en quelques minutes — gratuit, sans carte bancaire.