
Colorer chaque région
L'intensité de la couleur porte la valeur. Le bon choix pour les taux, les parts et les données par habitant, déjà ajustés à la taille ou à la population.
Ouvrir le modèleA blank New Jersey county map to print, and a builder to fill it with your own data. Download the free outline of all 21 counties, or upload a spreadsheet and publish an interactive New Jersey map you can embed anywhere.
Les 21 counties, en tracé net. Imprimez-le, coloriez-le ou insérez-le dans un document — sans compte et sans attribution.
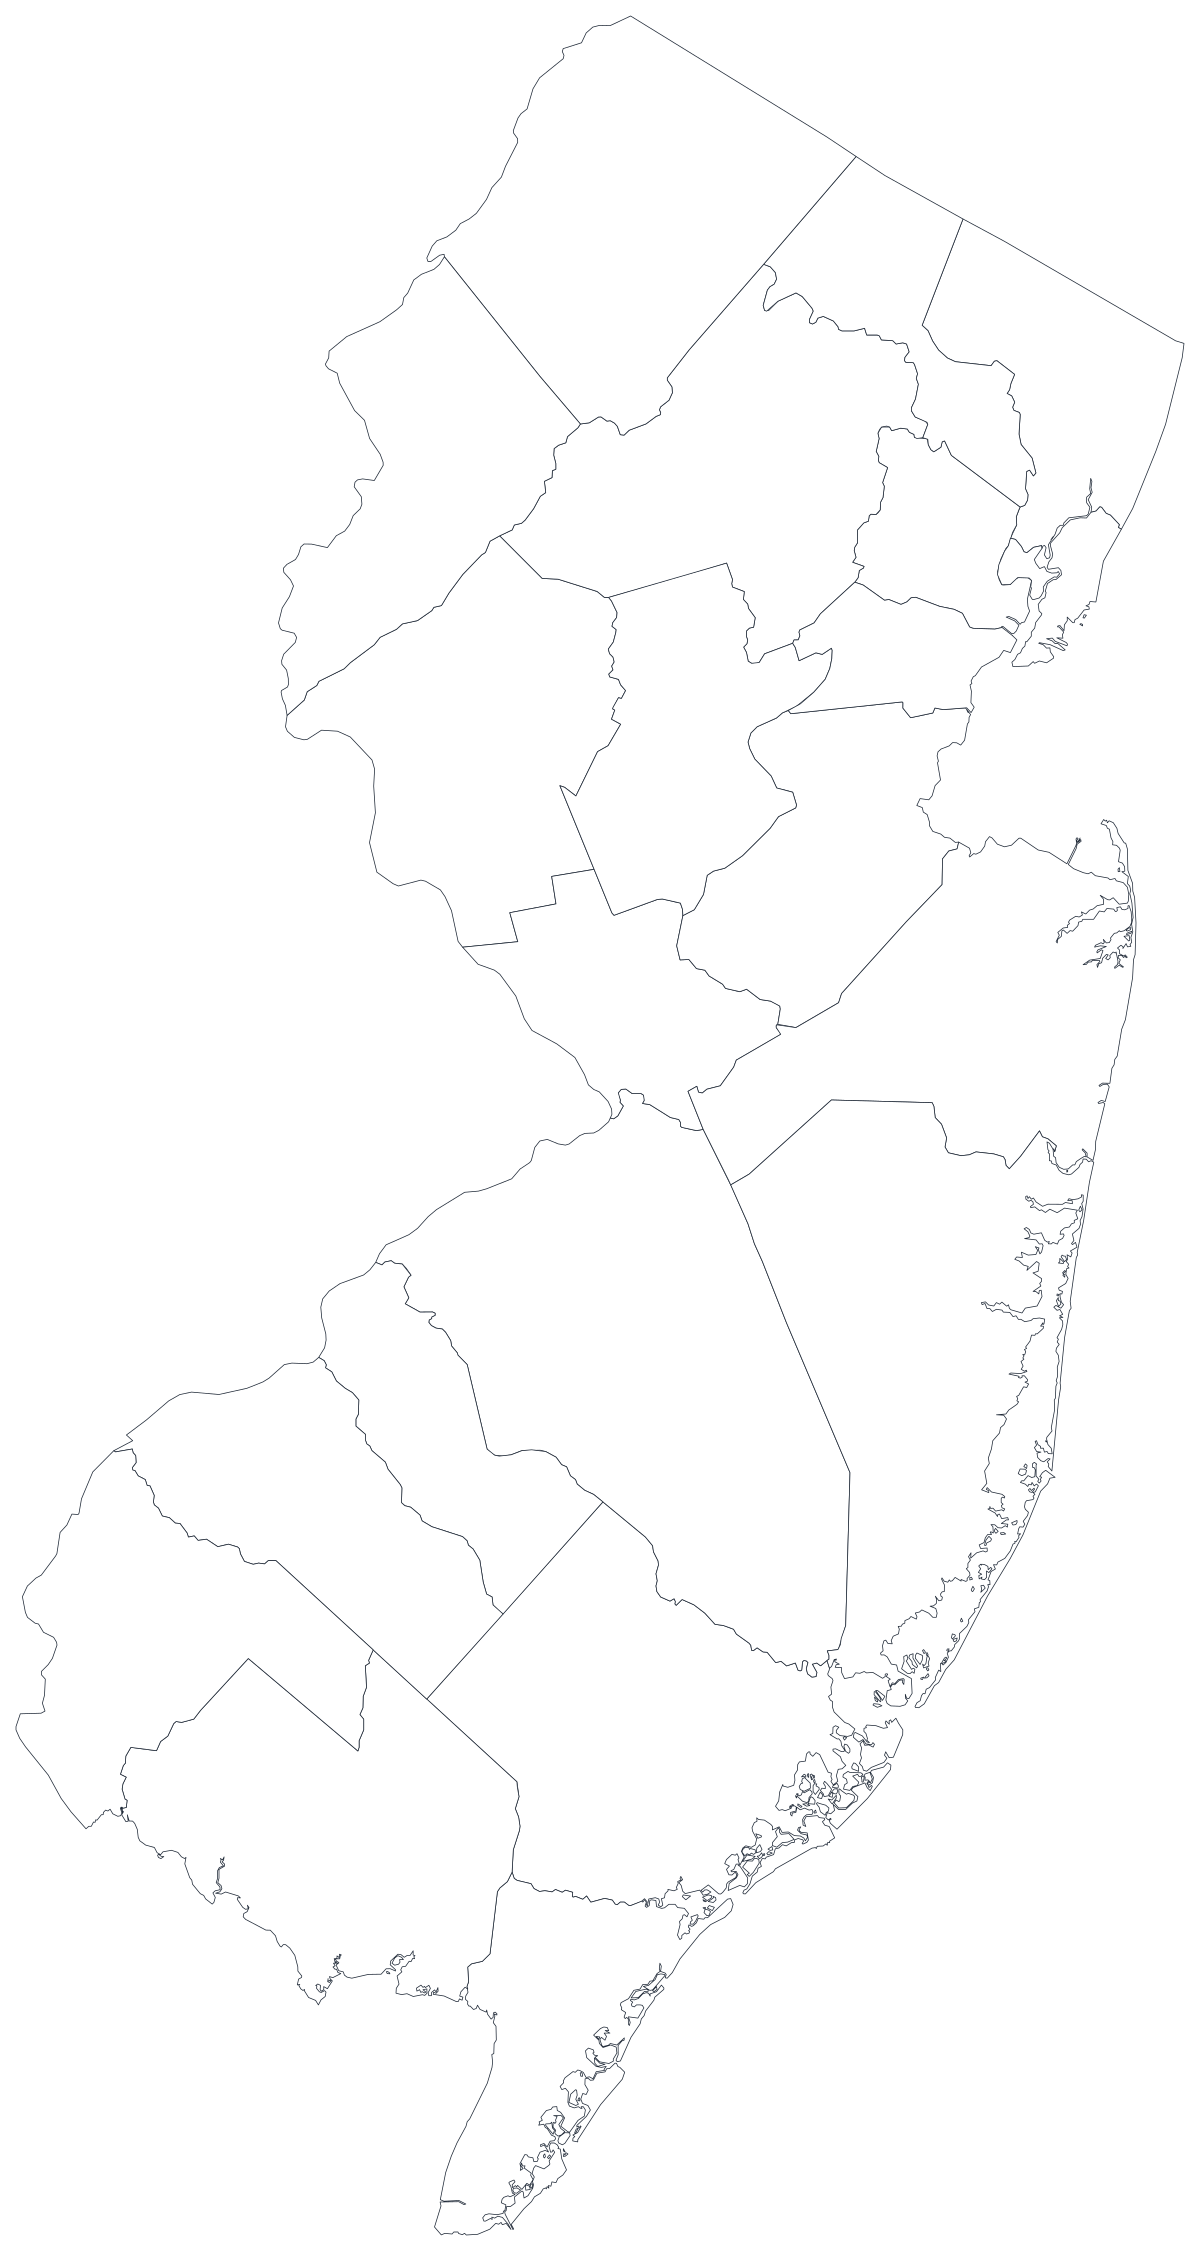
Libre pour tout usage, y compris commercial et scolaire. Généré à partir des mêmes contours que l'éditeur.
Télécharger le SVGNew Jersey divides into just 21 counties, which makes it one of the easiest states to map and one of the easiest to over-read. Twenty-one shapes is few enough that every county gets a legible label and a reader can hold the whole picture at once — but it also means each shape covers a lot of very different ground. The state is pulled between two metros it does not contain: the northern counties orbit New York City, the southern ones orbit Philadelphia, and that divide shows up in almost any dataset you shade. Add the density gradient from Hudson County to the Pine Barrens and most New Jersey maps end up telling one of those two stories whether you intended them to or not.
Colorez les régions pour un taux, dimensionnez un marqueur pour un effectif. Inverser les deux est la façon la plus courante de tromper le lecteur.
L'intensité de la couleur porte la valeur. Le bon choix pour les taux, les parts et les données par habitant, déjà ajustés à la taille ou à la population.
Ouvrir le modèleUn symbole par région, mis à l'échelle selon la valeur. À utiliser pour les effectifs et les totaux, là où colorer la surface ne ferait que redessiner la carte de la population.
Ouvrir le modèleDes cercles dimensionnés par la valeur, posés sur le tracé. Efficace quand quelques régions dominent et que les petites disparaîtraient dans un aplat.
Ouvrir le modèleDepartment of Health indicators, Labor and Workforce Development figures, Department of Education enrolment and Division of Elections returns are all published by county.
Unemployment rate, uninsured share, share of votes, median household income. Rates already account for how many people live in a county, which is what shading needs.
It is the state's defining split and it is geographic, which means a map argues it far better than a table. The same is true of the density gradient from the Hudson waterfront out to the Pinelands.
Classroom exercises, territory planning, colour-by-hand sessions. With only 21 regions the free outline above stays readable even at a quarter of a page.
New Jersey governs through its municipalities — there are hundreds of them, and school districts, police, and land use largely sit at that level. Rolling them up to 21 counties throws away most of the variation you were trying to show.
Shade by a raw count and the dense northern counties win every time. Anything that grows simply because more people live there should be a sized symbol, not a shade.
Hudson County is tiny and packed; Burlington and Ocean are large and comparatively empty. A choropleth gives the empty ones most of the ink, so check whether that is the impression you want before publishing.
If the pattern you are showing is a metro one, a state map cuts it in half at the river. Use the US county map so the reader can see both sides of the line.
Du tableur à la carte publiée, étape par étape.
The free outline above is a plain SVG of all 21 counties — print it, or drop it into a document. To build with data, open the PlotSet New Jersey (counties) template, which comes with sample data already bound.
One row per county: the five-digit FIPS code or the county name in the first column, your number in the second. New Jersey FIPS codes all begin 34.
Import a CSV or Excel file, paste from a spreadsheet, or connect a Google Sheet so the map can be refreshed when the source updates.
Shade the counties for a rate, or switch to symbols or bubbles for a count. With 21 regions, sized symbols stay legible in a way they do not on a 3,000-county map.
This is a map small enough to name every region. Twenty-one county labels fit comfortably, and a labelled map is far easier to read than one that sends people back to a legend.
Publish for a live interactive map with a tooltip on every county, or export a PNG, SVG or PDF for a report or a deck.
Partez du modèle New Jersey avec ses données d'exemple, puis remplacez-les par les vôtres.
Ouvrir le modèleÀ quoi doit ressembler la colonne des lieux, et où trouver des données déjà compatibles.
Atlantic, Bergen, Burlington, Camden, Cape May, Cumberland, Essex, Gloucester, Hudson, Hunterdon, Mercer, Middlesex, Monmouth, Morris, Ocean, Passaic, Salem, Somerset, Sussex, Union and Warren. No abbreviations and no saints, so name joins are more reliable here than in most states.
It is the one name that regularly arrives as CapeMay or Cape-May from an export. Everything else matches straight through.
34001 is Atlantic, 34041 is Warren, and the county part runs in odd numbers rather than sequentially. Store the column as text so the codes keep their shape.
The New Jersey Department of Health, the Department of Labor and Workforce Development, the Department of Education and the Division of Elections all publish county tables, as does the Census Bureau's ACS.
In the most densely populated state in the country, a count map is a population map. Use a sized symbol for counts and keep shading for rates and shares.
New Jersey's towns are where most of the variation lives. Averaging them into 21 counties can flatten a real finding into a flat map.
Ocean and Burlington counties take up a large share of the map and a much smaller share of the people. If the subject is people, say so in the caption or use a symbol map.
A sequence of hues has no natural order, so readers cannot tell high from low without checking the legend on every county. Use one hue, light to dark.
Yes. The outline above is a free SVG of all 21 New Jersey counties — right-click to save it, print it, or drop it into a worksheet or document. No account needed.
Importez un tableur et publiez une carte interactive en quelques minutes — gratuit, sans carte bancaire.