
Colorir cada região
A intensidade da cor carrega o valor. A escolha certa para taxas, proporções e números per capita, já ajustados ao tamanho ou à população.
Abrir o modeloA blank Illinois county map to print, and a builder to fill it with your own data. Download the free outline of all 102 counties, or upload a spreadsheet and publish an interactive Illinois map you can embed anywhere.
Todos os 102 counties, em traço limpo. Imprima, pinte ou insira em um documento — sem conta e sem atribuição.
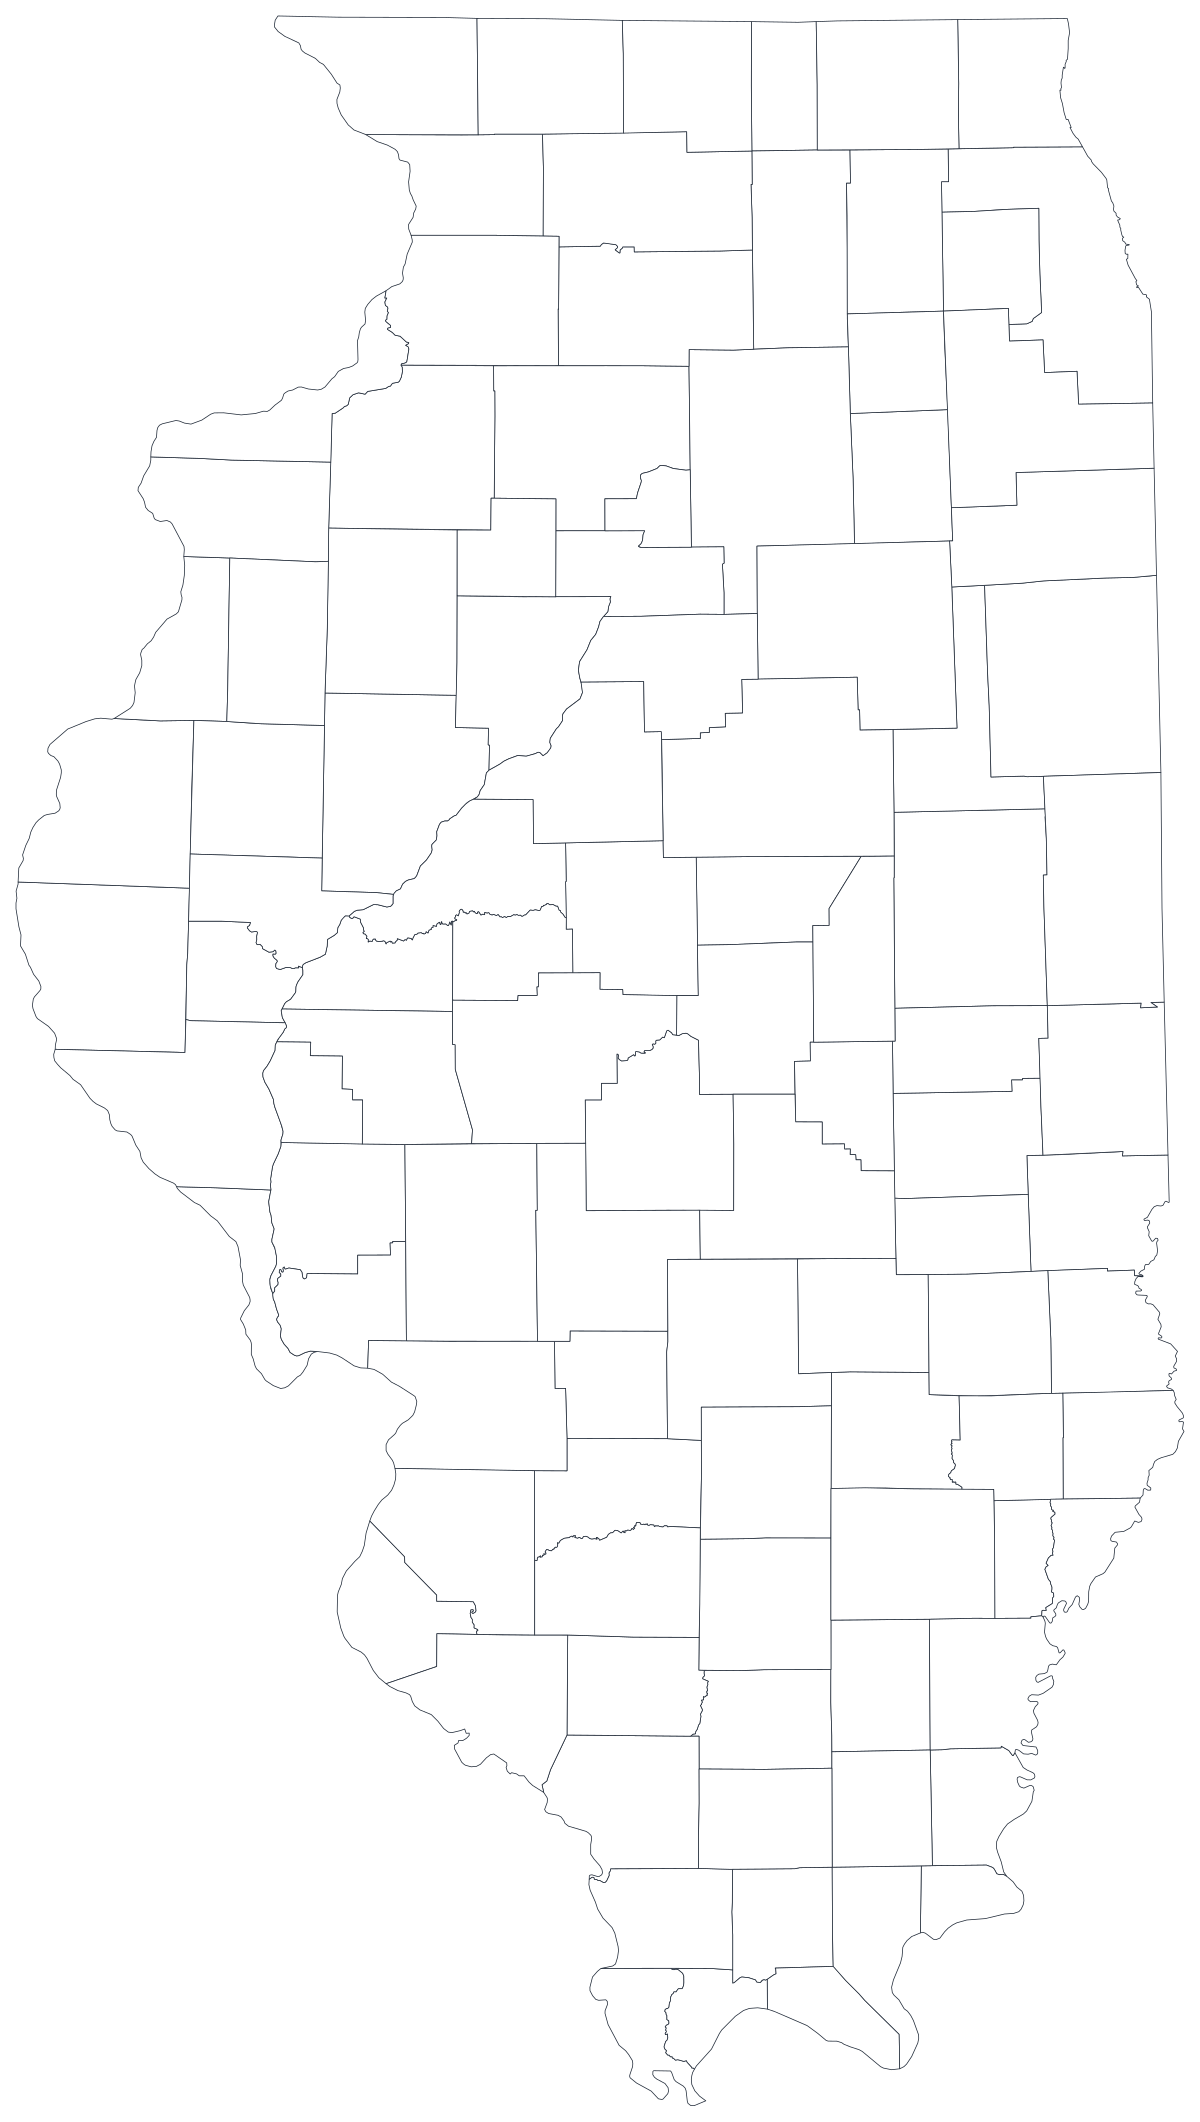
Livre para qualquer uso, inclusive comercial e escolar. Gerado a partir dos mesmos limites usados pelo editor.
Baixar SVGIllinois divides into 102 counties, and it is one of the most lopsided county maps in the country. Cook County occupies a small rectangle in the northeast corner and holds roughly two out of every five people in the state; add the five collar counties around it and you have somewhere near two-thirds of Illinois inside about four per cent of its area. The other ninety-six counties run south for four hundred miles through corn, coal and river towns, and they are drawn at a size that reflects the nineteenth-century idea of a day's ride to the courthouse rather than anything about who lives there now. Every honest Illinois county map has to deal with that imbalance, and most of the design decisions on this page come back to it.
Colora as regiões quando o número for uma taxa; dimensione um marcador quando for uma contagem. Inverter isso é a maneira mais comum de um mapa enganar.
A intensidade da cor carrega o valor. A escolha certa para taxas, proporções e números per capita, já ajustados ao tamanho ou à população.
Abrir o modeloUm símbolo por região, escalado pelo valor. Use para contagens e totais, em que colorir a área apenas redesenharia o mapa da população.
Abrir o modeloCírculos dimensionados pelo valor sobre o contorno. Funciona bem quando poucas regiões dominam e as pequenas sumiriam em uma cor chapada.
Abrir o modeloIDPH health indicators, IDES labour and wage figures, Illinois State Board of Education report-card data, USDA crop statistics and State Board of Elections returns are all published by county.
Unemployment rate, uninsured share, share of households with broadband, share of the vote, median household income. Rates are already adjusted for population, which is what shading a region needs.
It is the single most common comparison made about this state, and a county map is the only way to make it without asserting where the line falls — the reader sees Cook and the collar counties and draws it themselves.
Classroom exercises, county fair and extension materials, planning workshops, colour-by-hand sessions. The free outline above prints cleanly at any size.
Shade Illinois by a raw count and you have drawn Cook County. Nothing else on the map can compete with it, and the other 101 shapes collapse into a single pale band. Use symbols or bubbles sized by the count instead.
Chicago's neighbourhoods, wards and community areas all live inside one shape here. A county map cannot show anything that varies within the city, which is most of what people want to say about Chicago.
Madison and St. Clair belong to the St. Louis metro; Lake and McHenry blend into southern Wisconsin. If that is the point, use the US county map so the reader can see past the border.
Southern Illinois counties are small in population, and suppressed cells are common in health releases. A map with seventy grey shapes and thirty coloured ones is a worse bar chart — rank the counties you do have.
Da planilha ao mapa publicado, passo a passo.
The free outline above is a plain SVG of all 102 counties — print it, or drop it into a document. To build with data, open the PlotSet Illinois (counties) template, which comes with sample data already bound.
One row per county: the county name or its five-digit FIPS code in the first column, your number in the second. FIPS codes for Illinois all begin 17.
Import a CSV or Excel file, paste from a spreadsheet, or connect a Google Sheet so the map can be refreshed when the source updates.
Shade the counties for a rate, or switch to symbols or bubbles for a count. Same geography, same data, different encoding.
Sequential for a low-to-high measure, diverging only when a real midpoint exists — the state average, zero change, a 50 per cent line. Four to six steps read more precisely than a smooth gradient.
Publish for a live interactive map with a tooltip on every county, or export a PNG, SVG or PDF for a report or a deck.
Comece pelo modelo de Illinois com os dados de exemplo e depois troque pelos seus.
Abrir o modeloComo deve ser a coluna de lugares e onde encontrar dados que já combinam.
The joins that fail are the run-together and apostrophe-free names: DuPage, DeKalb, DeWitt, LaSalle and Jo Daviess appear in datasets as "Du Page", "De Kalb", "De Witt", "La Salle" and "JoDaviess" about as often as not. St. Clair carries a full stop. Kankakee, Sangamon, Winnebago and Menard are routinely mistyped.
17001 is Adams, 17031 is Cook, 17203 is Woodford. Store the column as text so the codes keep their shape, and remember the county part is odd-numbered rather than sequential.
Illinois has a Lake County north of Chicago and Indiana has one immediately to its southeast; they touch. Any dataset joined on name alone will hand one's rows to the other, and the two are close enough on the map that the error is easy to miss.
In Illinois usage it means everywhere outside Chicagoland, including Rockford and Galena, which are north of Chicago. If your dataset carries a downstate flag, check what it actually contains before mapping it as a region.
IDPH, the Illinois Department of Employment Security, the Illinois State Board of Education, the State Board of Elections and the Census Bureau's ACS all publish county tables. The University of Illinois Extension is the usual source for agricultural series.
On this state it is the most damaging version of the mistake anywhere in the country: one county with two out of five residents will take the darkest class and flatten everything else to nothing.
The collar counties are small shapes carrying enormous numbers, and the southern counties are large shapes carrying very few. Shading by area silently argues the opposite of the demography — say so in the caption, or pair the map with a sorted bar chart.
Putnam is the smallest county in the state by area and disappears at web sizes. If one of the small shapes carries the story, label it directly or add an inset.
Health and education releases blank out small counts for privacy. Import those cells as empty rather than as 0, or the sparsest counties will read as the healthiest ones on the map.
A sequence of hues has no natural order, so readers cannot tell high from low without checking the legend on every county. Use one hue, light to dark.
Yes. The outline above is a free SVG of all 102 Illinois counties — right-click to save it, print it, or drop it into a worksheet or document. No account needed.
Envie uma planilha e publique um mapa interativo em poucos minutos — grátis, sem cartão de crédito.