
Colorir cada região
A intensidade da cor carrega o valor. A escolha certa para taxas, proporções e números per capita, já ajustados ao tamanho ou à população.
Abrir o modeloLouisiana has parishes rather than counties — 64 of them, and they work exactly like counties everywhere else. Download the free blank outline to print, or upload a spreadsheet and publish an interactive Louisiana parish map you can embed anywhere.
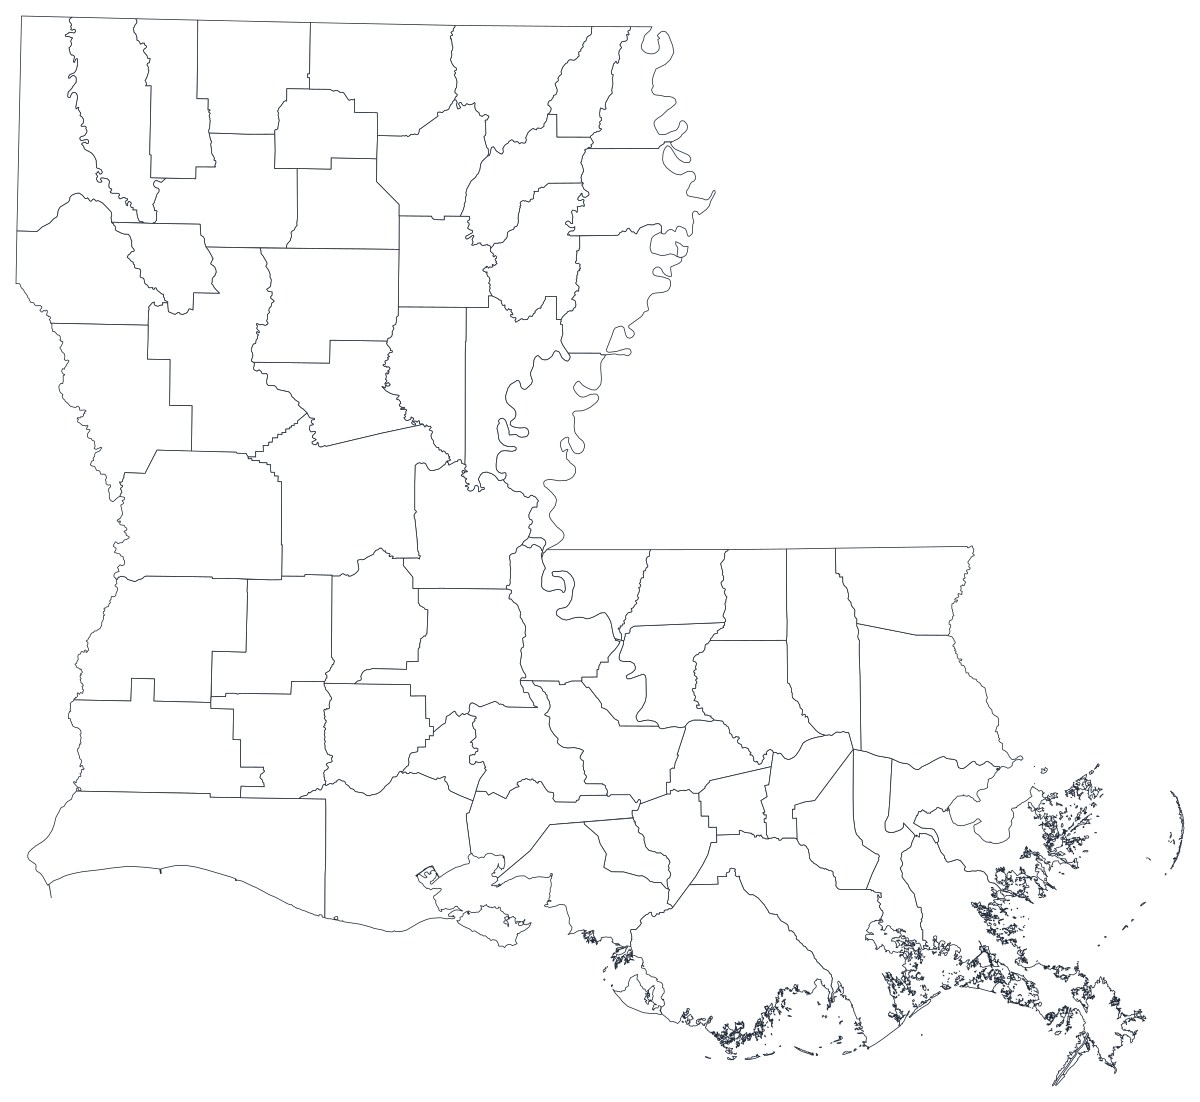
Todos os 64 parishes, em traço limpo. Imprima, pinte ou insira em um documento — sem conta e sem atribuição.
Livre para qualquer uso, inclusive comercial e escolar. Gerado a partir dos mesmos limites usados pelo editor.
Baixar SVGLouisiana is the only state that calls its counties parishes — a survival of the colonial church parishes the territorial legislature adopted as civil divisions in 1807, and the reason a search for a Louisiana county map returns parishes. Functionally they are counties: the Census Bureau treats them as county equivalents, gives them county FIPS codes, and reports the same tables for them as for anywhere else. There are 64. The population sits along an arc from Shreveport down through Alexandria and across the Baton Rouge to New Orleans corridor, with Acadiana around Lafayette to the south-west and a rural, thinning north. The coastal parishes — Plaquemines, Terrebonne, Lafourche, Cameron, St. Bernard — are the ones to think about hardest: they are large on the page, small in population, and their outlines describe a coastline that is genuinely moving.
Colora as regiões quando o número for uma taxa; dimensione um marcador quando for uma contagem. Inverter isso é a maneira mais comum de um mapa enganar.
A intensidade da cor carrega o valor. A escolha certa para taxas, proporções e números per capita, já ajustados ao tamanho ou à população.
Abrir o modeloUm símbolo por região, escalado pelo valor. Use para contagens e totais, em que colorir a área apenas redesenharia o mapa da população.
Abrir o modeloCírculos dimensionados pelo valor sobre o contorno. Funciona bem quando poucas regiões dominam e as pequenas sumiriam em uma cor chapada.
Abrir o modeloLouisiana Department of Health indicators, Workforce Commission employment figures, Department of Education enrolment and performance data, and Secretary of State election returns are all published by parish.
Flood insurance take-up, uninsured rate, turnout, median household income. A rate is already adjusted for population, which is what shading a region needs.
Storm exposure, land loss, evacuation, insurance and recovery money are all distributed geographically. On a parish map the pattern is the argument; in a table it is a list of names.
Classroom exercises, parish-by-parish planning, colour-by-hand worksheets. The free outline above prints cleanly at any size.
Shade by a raw count and East Baton Rouge, Jefferson and Orleans take the map every time. Use symbols or bubbles sized by the count instead.
Most school systems are parish-wide, but a handful of city systems sit inside them, and New Orleans is the one place where the municipality and the parish are the same thing. Check which you have before flattening it onto parishes.
Parish boundaries in the coastal zone include open water and marsh that has already gone. If you are mapping land loss itself, map the land, not the administrative shape around it.
If the point is how Louisiana sits against Texas, Mississippi or the Gulf as a whole, use the US county map so the reader can see across the state line.
Da planilha ao mapa publicado, passo a passo.
The free outline above is a plain SVG of all 64 parishes — print it, or drop it into a document. To build with data, open the PlotSet Louisiana template, which loads with sample data already bound.
One row per parish: the parish name or its five-digit FIPS code in the first column, your number in the second. Louisiana FIPS codes all begin 22.
Import a CSV or Excel file, paste from a spreadsheet, or connect a Google Sheet so the map can be refreshed when the source updates.
Shade the parishes for a rate, or switch to symbols or bubbles for a count — which also stops the large, empty coastal parishes from dominating a map about people.
Sequential for a low-to-high measure, diverging only when a real midpoint exists — the state average, zero change, a 50 per cent line. Four to six steps read more precisely than a smooth gradient.
Publish for a live interactive map with a tooltip on every parish, or export a PNG, SVG or PDF for a report or a deck.
Comece pelo modelo de Louisiana com os dados de exemplo e depois troque pelos seus.
Abrir o modeloComo deve ser a coluna de lugares e onde encontrar dados que já combinam.
People look for a Louisiana county map and find parishes, which is fine — but a chart that labels them counties will look wrong to every reader in the state. The word in your title should be parish.
There are nine of them — St. Bernard, St. Charles, St. Helena, St. James, St. John the Baptist, St. Landry, St. Martin, St. Mary and St. Tammany. Sources disagree on St. versus Saint, and St. John the Baptist gets truncated and re-spaced constantly. Join on FIPS and none of it matters.
East and West Baton Rouge, East and West Feliciana, East and West Carroll are six separate parishes. So are Jefferson and Jefferson Davis. Any of them can be silently collapsed by a partial-match join.
The Louisiana Department of Health, the Louisiana Workforce Commission, the Department of Education and the Secretary of State all publish parish tables, as does the Census Bureau's American Community Survey.
The search term is one thing; the label on the chart is another. Louisiana has parishes, and using the wrong word is the fastest way to lose a Louisiana audience.
It produces a population map every time. Anything that grows simply because more people live there should be a sized symbol, not a shade.
Plaquemines, Cameron and Terrebonne are among the biggest shapes on the map and among the emptiest. A dark colour there covers far fewer people than the same colour over Jefferson.
St. Tammany, Saint Tammany and ST TAMMANY are three different strings. A mismatch leaves a blank parish rather than an error, so check the join count, not just the picture.
A sequence of hues has no natural order, so readers cannot tell high from low without checking the legend on every parish. Use one hue, light to dark.
Parishes. Louisiana is the only state that uses the term — Alaska uses boroughs, and everywhere else uses counties. The Census Bureau treats parishes as county equivalents, so any dataset published by county covers Louisiana's parishes too.
Envie uma planilha e publique um mapa interativo em poucos minutos — grátis, sem cartão de crédito.