
Colorir cada região
A intensidade da cor carrega o valor. A escolha certa para taxas, proporções e números per capita, já ajustados ao tamanho ou à população.
Abrir o modeloA blank Pennsylvania county map to print, and a builder to fill it with your own data. Download the free outline of all 67 counties, or upload a spreadsheet and publish an interactive Pennsylvania map you can embed anywhere.
Todos os 67 counties, em traço limpo. Imprima, pinte ou insira em um documento — sem conta e sem atribuição.
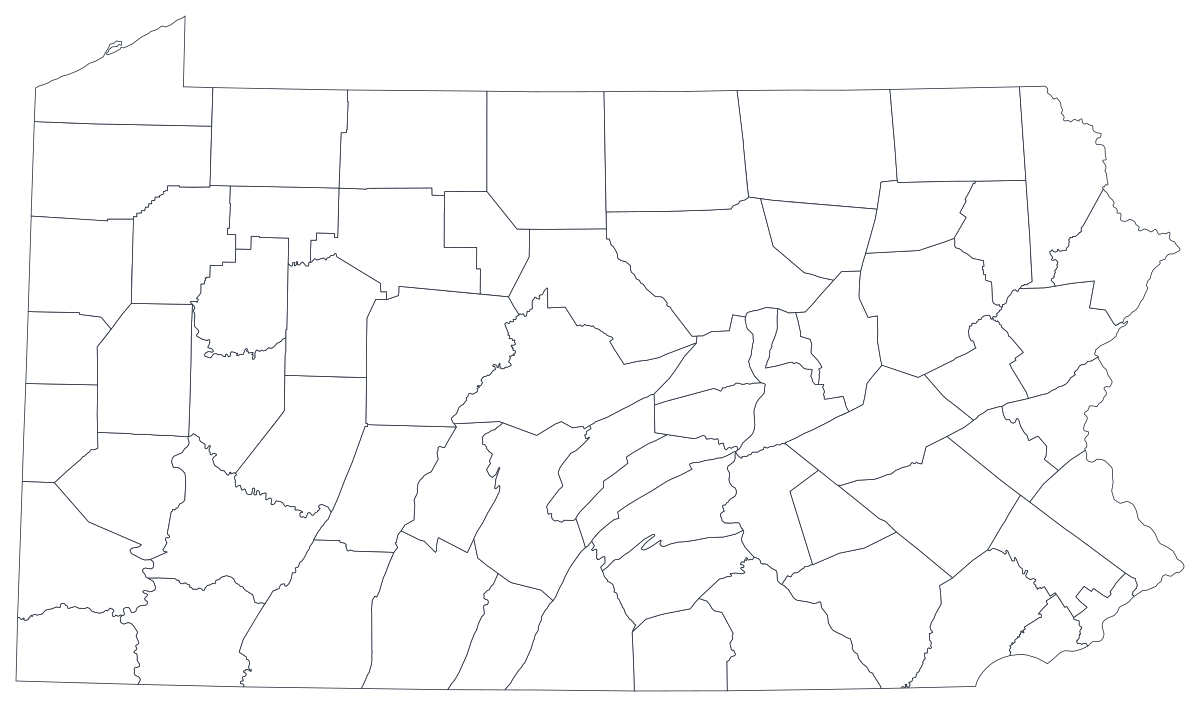
Livre para qualquer uso, inclusive comercial e escolar. Gerado a partir dos mesmos limites usados pelo editor.
Baixar SVGPennsylvania divides into 67 counties, and the state's shape does a lot of the explaining. Philadelphia sits in the far south-east corner, coterminous with its county and the densest place in the state by a wide margin. Allegheny, holding Pittsburgh, sits at the opposite end in the south-west. Between them run roughly fifty counties of ridge, valley and small town, several of which have fewer than 20,000 residents — Cameron County has around 4,500. Almost every Pennsylvania statistic ends up being about that arrangement: two metropolitan poles, a long rural middle, and a set of suburban collar counties around Philadelphia that behave like neither. It is also why Pennsylvania county maps are drawn so often at election time, and why the same map with the same data can support two opposite headlines depending on whether you shaded the land or sized the people.
Colora as regiões quando o número for uma taxa; dimensione um marcador quando for uma contagem. Inverter isso é a maneira mais comum de um mapa enganar.
A intensidade da cor carrega o valor. A escolha certa para taxas, proporções e números per capita, já ajustados ao tamanho ou à população.
Abrir o modeloUm símbolo por região, escalado pelo valor. Use para contagens e totais, em que colorir a área apenas redesenharia o mapa da população.
Abrir o modeloCírculos dimensionados pelo valor sobre o contorno. Funciona bem quando poucas regiões dominam e as pequenas sumiriam em uma cor chapada.
Abrir o modeloDepartment of Health indicators, Department of Labor and Industry unemployment figures, Department of Education enrolment and Department of State election returns are all published by county.
Unemployment rate, overdose deaths per 100,000, broadband coverage, share of the vote. Rates are already adjusted for population, which is what shading a region needs.
The gap between the Philadelphia and Pittsburgh metros and the counties between them runs through income, health, age and turnout alike. On a county map it reads as one picture rather than a paragraph.
Classroom exercises, canvassing plans, colour-by-hand sessions. The free outline above prints cleanly at any size.
Shade by a raw count and Philadelphia, Allegheny and the collar counties win every time — the south-east alone holds roughly a third of the state. Use symbols or bubbles sized by the count instead.
Pennsylvania has more than 2,500 municipalities and around 500 school districts, and they do not nest neatly inside counties. Mapping either onto 67 shapes will misplace what you are describing.
Philadelphia County is one shape whether Chestnut Hill and Kensington look alike or nothing alike. Below the county line, use ZIP codes, wards or census tracts.
A map with fifty grey shapes and seventeen coloured ones is a worse bar chart. If coverage is patchy, rank the counties you do have.
Da planilha ao mapa publicado, passo a passo.
The free outline above is a plain SVG of all 67 counties — print it, or drop it into a document. To build with data, open the PlotSet Pennsylvania (counties) template, which comes with sample data already bound.
One row per county: the county name or its five-digit FIPS code in the first column, your number in the second. FIPS codes for Pennsylvania all begin 42.
Import a CSV or Excel file, paste from a spreadsheet, or connect a Google Sheet so the map can be refreshed when the source updates.
Shade the counties for a rate, or switch to symbols or bubbles for a count. Same geography, same data, different encoding.
Sequential for a low-to-high measure, diverging only when a real midpoint exists — the state average, zero change, a 50 per cent line. Four to six steps read more precisely than a smooth gradient.
Publish for a live interactive map with a tooltip on every county, or export a PNG, SVG or PDF for a report or a deck.
Comece pelo modelo de Pennsylvania com os dados de exemplo e depois troque pelos seus.
Abrir o modeloComo deve ser a coluna de lugares e onde encontrar dados que já combinam.
The template's county names carry a space: 'Mc Kean', not 'McKean'. If your source spells it the usual way, that one row will silently fail to join and leave a blank county in the north. Matching on FIPS avoids it entirely.
Centre, not Center — it is the home of State College and Penn State. Any pipeline that normalises American spellings will quietly rename it and lose the join.
Delaware, Indiana, Washington and Wyoming are all Pennsylvania counties. In a national table, filtering on those names without a state column will pull in the wrong rows — and Washington County, Pennsylvania is a particularly common false match.
42001 is Adams, 42133 is York. Store the column as text so the digits survive, and note that the county part is odd-numbered rather than sequential.
The Department of Health, the Department of Labor and Industry, the Department of Education, the Department of State and the Department of Environmental Protection all publish county tables, as does the Census Bureau's ACS.
It produces a population map every time. Anything that grows simply because more people live there should be a sized symbol, not a shade.
Pennsylvania is the state this mistake is made on most. Fifty lightly populated counties can cover most of the map while holding a minority of the electorate — if you are mapping results, size the symbols by turnout or say plainly what the shading means.
'Mc Kean' versus 'McKean' and 'Centre' versus 'Center' are the two that bite here, and a silent mismatch leaves a blank shape rather than an error. Join on FIPS where you can.
They are the same boundary, so city-level and county-level figures for Philadelphia are interchangeable — but only for Philadelphia. Do not assume the same holds for Pittsburgh, which is part of a much larger Allegheny County.
A sequence of hues has no natural order, so readers cannot tell high from low without checking the legend on every county. Use one hue, light to dark.
Yes. The outline above is a free SVG of all 67 Pennsylvania counties — right-click to save it, print it, or drop it into a worksheet or document. No account needed.
Envie uma planilha e publique um mapa interativo em poucos minutos — grátis, sem cartão de crédito.