
为每个区域填色
颜色深浅代表数值。适合比率、占比和人均指标——这些数字已经消除了面积和人口规模的影响。
打开模板A blank Virginia county map to print, and a builder to fill it with your own data. Download the free outline of the counties and independent cities, or upload a spreadsheet and publish an interactive Virginia map you can embed anywhere.
全部 132 个counties and independent cities,线条干净的轮廓图。可打印、可填色、可放进文档——无需注册,也无需署名。
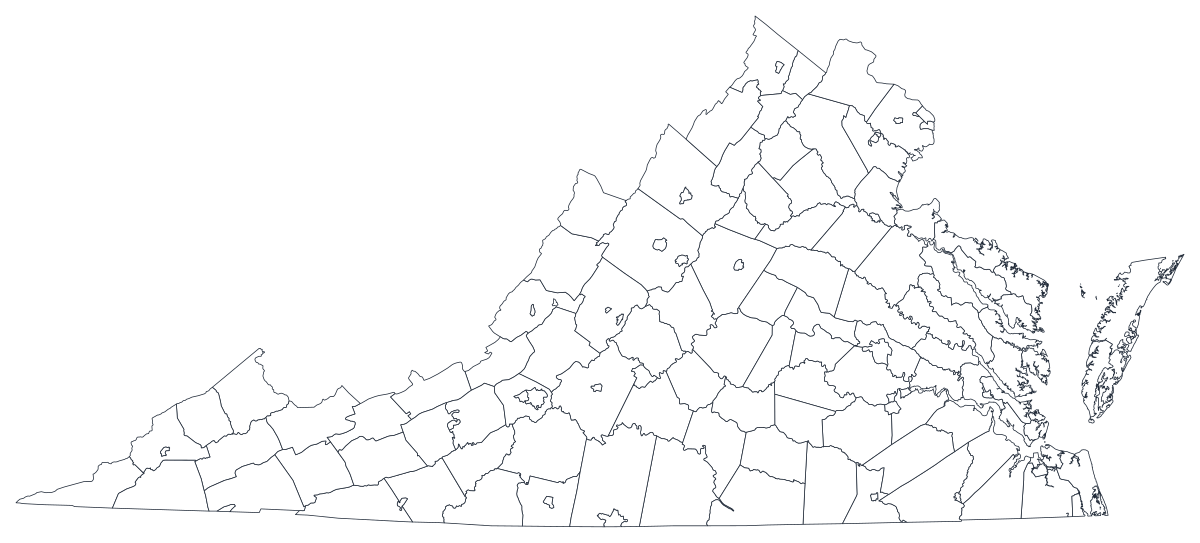
任何用途均可免费使用,包括商用与课堂。由编辑器所用的同一套边界数据生成。
下载 SVGVirginia is the hardest county map in the United States to get right, and the reason is a piece of constitutional history rather than geography. The state has 95 counties and 38 independent cities, and an independent city belongs to no county at all — it is a peer of the county beside it, reported separately by the Census Bureau and by every state agency. That gives Virginia 133 county-equivalents, more than any state except Texas and Georgia, and it means the shapes on the map do not nest the way they do everywhere else. The other thing the map shows immediately is that Virginia is really four states: the Northern Virginia suburbs of Washington, the Hampton Roads cities around the mouth of the Chesapeake, the Richmond metro in the middle, and a long rural belt through Southside and into the coalfields of the far southwest. Nearly every Virginia county map is a picture of that split, whatever it is measuring.
数值是比率时给区域填色,是计数时用大小不同的标记。把这两者用反,是数据地图最常见的误导方式。
Virginia Department of Health indicators, Virginia Employment Commission labour figures, Department of Education enrolment, Weldon Cooper Center population estimates and Department of Elections returns are all published by county and independent city.
Unemployment rate, uninsured share, broadband coverage, share of the vote, median household income. A rate already accounts for how many people live in a place, which is what shading a region needs.
Fairfax, Arlington, Loudoun and Prince William plus their cities hold roughly a third of the state's people and a much larger share of its income. On a county map that contrast is the whole argument, and it needs no annotation.
Virginia studies is a required elementary subject in the state, and the counties-and-cities map is a standing classroom exercise. The free outline above prints cleanly at any size.
Falls Church, Manassas Park, Fairfax, Lexington and Norton are a few square miles each. On a shaded state map they are dots you cannot click and cannot see, so if the cities are what you are comparing, rank them in a bar chart and use the map only for context.
Shade by a raw count and the map draws Fairfax County and nothing else. Use symbols or bubbles sized by the count instead — that encoding does not depend on how much space a region takes up.
Hampton Roads spans a dozen cities and counties, Northern Virginia crosses into Maryland and DC, and Virginia's school divisions are city-and-county based but not one-to-one. Forcing any of them onto county shapes will misplace what you are describing.
Highland County has around two thousand residents and Norton fewer than four thousand, so suppressed cells are routine in health and education releases. A map that is mostly grey is a worse bar chart — rank the places you do have.
从表格到发布上线,一步一步来。
The free outline above is a plain SVG of Virginia's counties and independent cities — print it, or drop it into a worksheet. To build with data, open the PlotSet Virginia (counties) template, which comes with sample data already bound.
One row per county or city: the name or its five-digit FIPS code in the first column, your number in the second. Virginia's state code is 51, so every FIPS code starts 51 and no leading zero can be lost.
Census files distinguish "Fairfax County" from "Fairfax city", and "Roanoke County" from "Roanoke city". Strip the suffix and those pairs collapse into one ambiguous row. Keep it, or join on FIPS instead.
Import a CSV or Excel file, paste from a spreadsheet, or connect a Google Sheet so the map can be refreshed when the source updates.
Shade the regions for a rate, or switch to symbols or bubbles for a count — the second option is what rescues the small cities, because a bubble over Falls Church is visible when the city itself is not.
Publish for a live interactive map with a tooltip on every region, or export a PNG, SVG or PDF for a report or a deck.
从已加载示例数据的 Virginia 模板开始,再换成你自己的数据。
打开模板地点列应该长什么样,以及去哪里找现成能对上的数据。
This is the fact that breaks Virginia joins. An independent city is not part of the county that surrounds it, so its population, its cases and its votes are not included in that county's figures. Adding a city's number into the neighbouring county double-counts nothing, but it does silently invent a county that does not exist.
Bedford, Fairfax, Franklin, Richmond and Roanoke each name a county and an independent city, and in three of those cases they are nowhere near each other — Franklin County is in the southwest, the city of Franklin is by the North Carolina line in the southeast. A name-only join will put your numbers in the wrong half of the state.
The template geometry has 132 regions: all 95 counties plus 37 city shapes. The independent cities of Richmond and Franklin are not drawn separately — their names carry the counties — and Bedford is still drawn as a city although it reverted to a town inside Bedford County in 2013. Check those four places before you publish anything that depends on them.
Both are ordinary counties whose names end in "City". Cleaning scripts that filter or re-suffix on the word will drop them or move them into the wrong group, and they are two of the oldest counties in the country.
The Weldon Cooper Center for Public Service at UVA is the usual first stop for population estimates; the Department of Health, the Employment Commission, the Department of Education, the Department of Elections and the Census Bureau's ACS all publish tables by county and independent city.
It is the most common Virginia mistake and it is usually invisible. Folding the city of Roanoke into Roanoke County, or Charlottesville into Albemarle, produces a number that matches no official source and a map nobody can reconcile.
Fairfax County alone has more residents than eight US states. Shade a raw count and the map is a picture of Fairfax, every single time. Anything that grows simply because more people live somewhere belongs on a sized symbol.
The coalfield and Southside counties cover a lot of paper and hold few people, so on a shaded map they take visual weight their populations do not justify. Readers read area as importance — say so in the caption, or use bubbles.
With several places under five thousand residents, health and education releases blank out small counts routinely. Import those cells as empty rather than as 0, or the emptiest corners of the state will read as the healthiest ones.
A sequence of hues has no natural order, so readers cannot tell high from low without checking the legend on every region — and Virginia has 133 of them. Use one hue, light to dark.
Yes. The outline above is a free SVG of Virginia's counties and independent cities — right-click to save it, print it, or drop it into a worksheet or document. No account needed.
上传表格,几分钟内发布一张交互式地图——免费,无需信用卡。