
Colorear cada región
La intensidad del color transporta el valor. La opción correcta para tasas, porcentajes y cifras per cápita, ya ajustadas al tamaño o la población.
Abrir la plantillaA blank New Jersey county map to print, and a builder to fill it with your own data. Download the free outline of all 21 counties, or upload a spreadsheet and publish an interactive New Jersey map you can embed anywhere.
Los 21 counties, con un trazado limpio. Imprímelo, coloréalo o insértalo en un documento — sin cuenta y sin atribución.
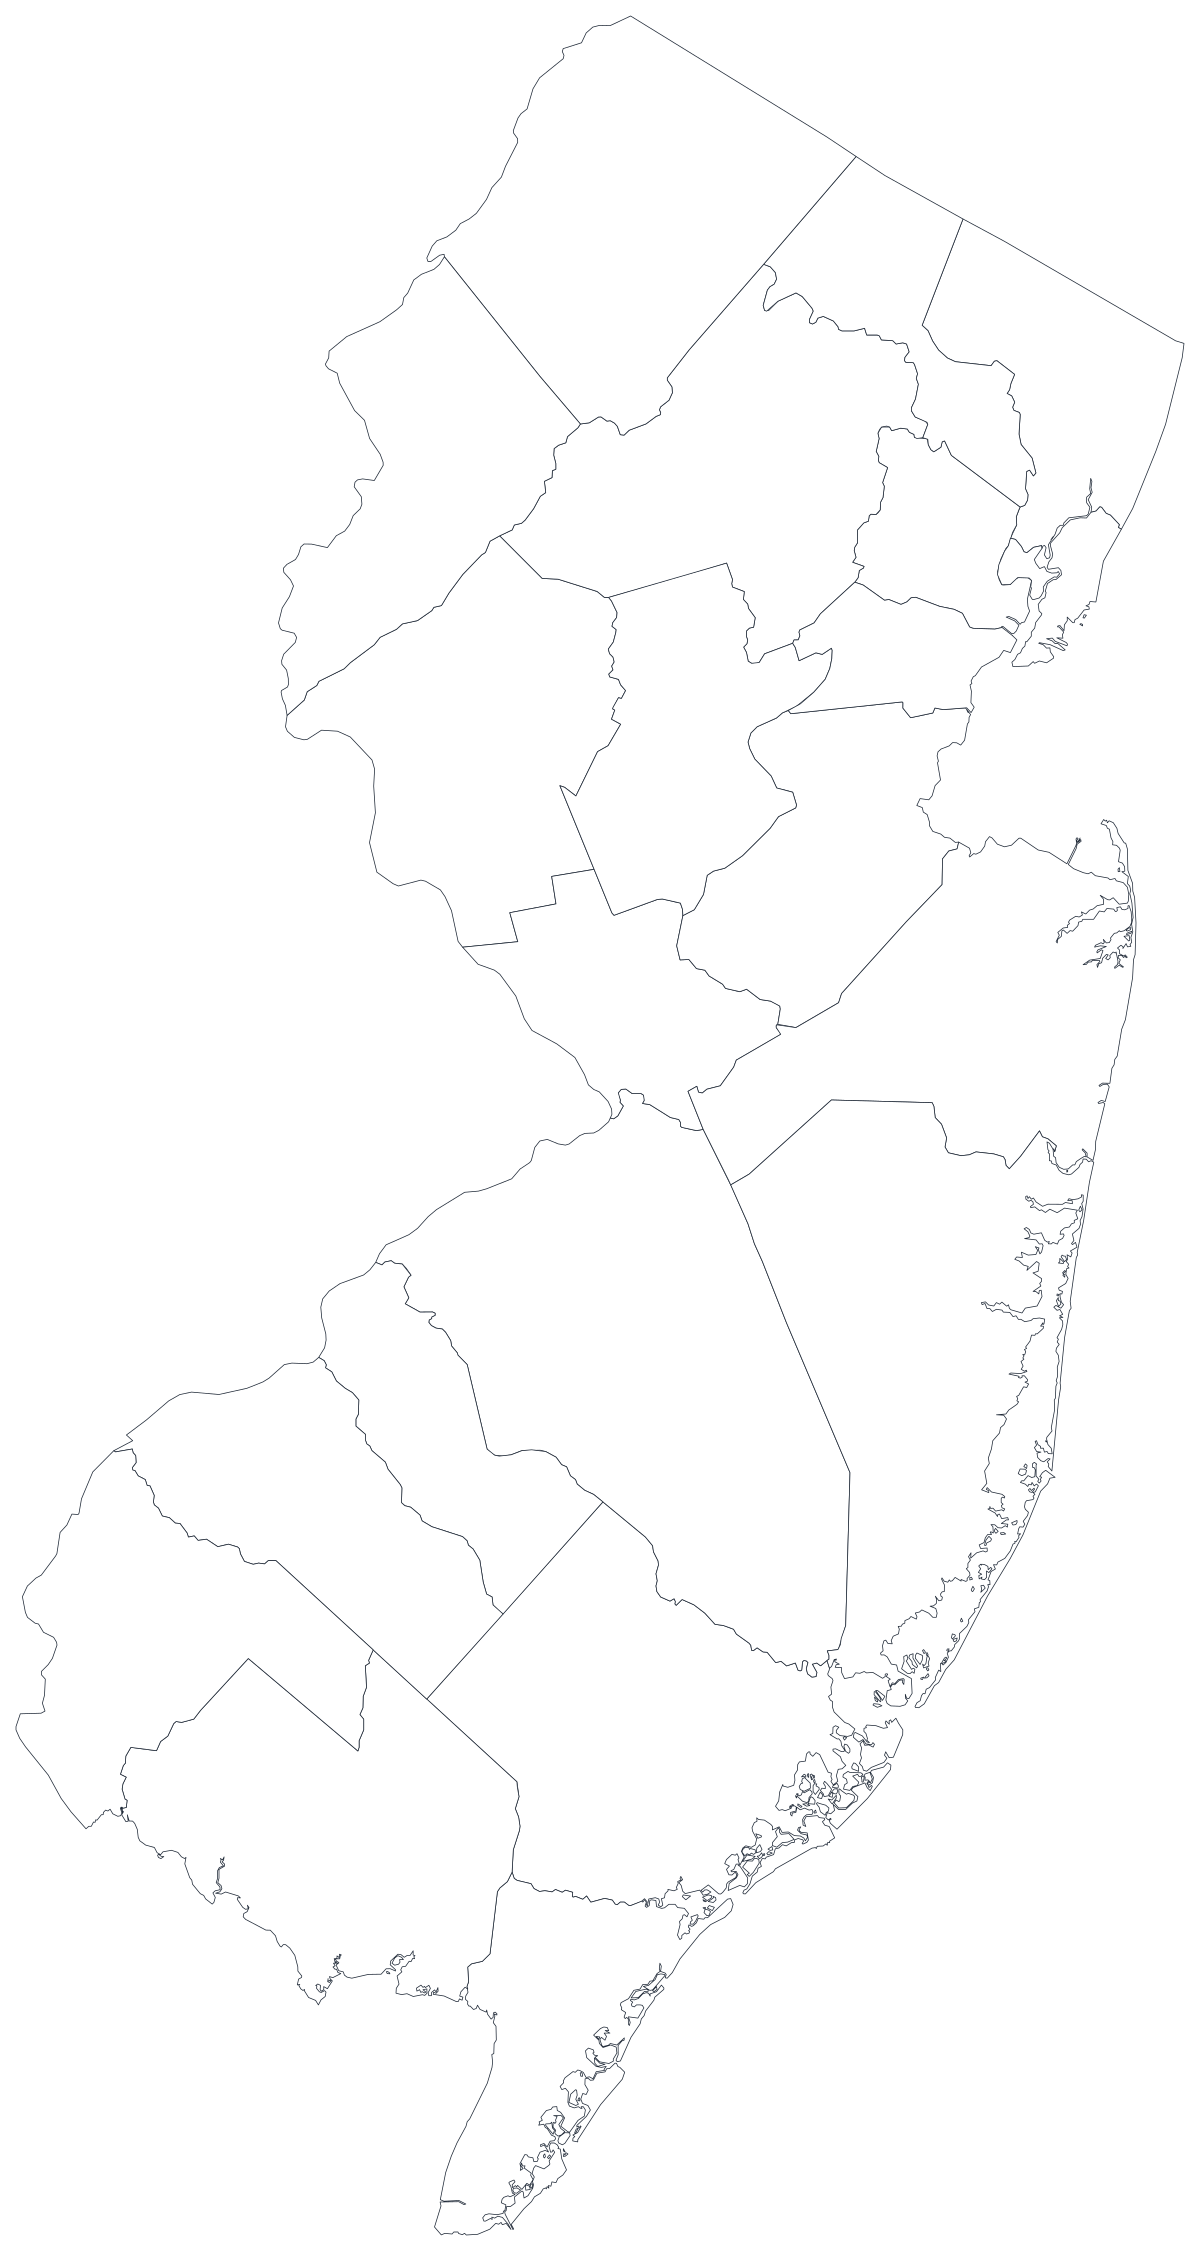
Libre para cualquier uso, incluidos el comercial y el educativo. Generado a partir de los mismos límites que usa el editor.
Descargar SVGNew Jersey divides into just 21 counties, which makes it one of the easiest states to map and one of the easiest to over-read. Twenty-one shapes is few enough that every county gets a legible label and a reader can hold the whole picture at once — but it also means each shape covers a lot of very different ground. The state is pulled between two metros it does not contain: the northern counties orbit New York City, the southern ones orbit Philadelphia, and that divide shows up in almost any dataset you shade. Add the density gradient from Hudson County to the Pine Barrens and most New Jersey maps end up telling one of those two stories whether you intended them to or not.
Colorea las regiones cuando tu cifra es una tasa; dimensiona un marcador cuando es un recuento. Invertirlo es la forma más común de que un mapa engañe.
La intensidad del color transporta el valor. La opción correcta para tasas, porcentajes y cifras per cápita, ya ajustadas al tamaño o la población.
Abrir la plantillaUn símbolo por región, escalado según el valor. Úsalo para recuentos y totales, donde colorear la superficie solo redibujaría el mapa de población.
Abrir la plantillaCírculos dimensionados por el valor sobre el contorno. Funciona bien cuando unas pocas regiones dominan y las pequeñas se perderían en un color.
Abrir la plantillaDepartment of Health indicators, Labor and Workforce Development figures, Department of Education enrolment and Division of Elections returns are all published by county.
Unemployment rate, uninsured share, share of votes, median household income. Rates already account for how many people live in a county, which is what shading needs.
It is the state's defining split and it is geographic, which means a map argues it far better than a table. The same is true of the density gradient from the Hudson waterfront out to the Pinelands.
Classroom exercises, territory planning, colour-by-hand sessions. With only 21 regions the free outline above stays readable even at a quarter of a page.
New Jersey governs through its municipalities — there are hundreds of them, and school districts, police, and land use largely sit at that level. Rolling them up to 21 counties throws away most of the variation you were trying to show.
Shade by a raw count and the dense northern counties win every time. Anything that grows simply because more people live there should be a sized symbol, not a shade.
Hudson County is tiny and packed; Burlington and Ocean are large and comparatively empty. A choropleth gives the empty ones most of the ink, so check whether that is the impression you want before publishing.
If the pattern you are showing is a metro one, a state map cuts it in half at the river. Use the US county map so the reader can see both sides of the line.
De la hoja de cálculo al mapa publicado, paso a paso.
The free outline above is a plain SVG of all 21 counties — print it, or drop it into a document. To build with data, open the PlotSet New Jersey (counties) template, which comes with sample data already bound.
One row per county: the five-digit FIPS code or the county name in the first column, your number in the second. New Jersey FIPS codes all begin 34.
Import a CSV or Excel file, paste from a spreadsheet, or connect a Google Sheet so the map can be refreshed when the source updates.
Shade the counties for a rate, or switch to symbols or bubbles for a count. With 21 regions, sized symbols stay legible in a way they do not on a 3,000-county map.
This is a map small enough to name every region. Twenty-one county labels fit comfortably, and a labelled map is far easier to read than one that sends people back to a legend.
Publish for a live interactive map with a tooltip on every county, or export a PNG, SVG or PDF for a report or a deck.
Empieza con la plantilla de New Jersey y sus datos de ejemplo, y luego sustitúyelos por los tuyos.
Abrir la plantillaCómo debe ser la columna de lugares y dónde encontrar datos que ya coincidan.
Atlantic, Bergen, Burlington, Camden, Cape May, Cumberland, Essex, Gloucester, Hudson, Hunterdon, Mercer, Middlesex, Monmouth, Morris, Ocean, Passaic, Salem, Somerset, Sussex, Union and Warren. No abbreviations and no saints, so name joins are more reliable here than in most states.
It is the one name that regularly arrives as CapeMay or Cape-May from an export. Everything else matches straight through.
34001 is Atlantic, 34041 is Warren, and the county part runs in odd numbers rather than sequentially. Store the column as text so the codes keep their shape.
The New Jersey Department of Health, the Department of Labor and Workforce Development, the Department of Education and the Division of Elections all publish county tables, as does the Census Bureau's ACS.
In the most densely populated state in the country, a count map is a population map. Use a sized symbol for counts and keep shading for rates and shares.
New Jersey's towns are where most of the variation lives. Averaging them into 21 counties can flatten a real finding into a flat map.
Ocean and Burlington counties take up a large share of the map and a much smaller share of the people. If the subject is people, say so in the caption or use a symbol map.
A sequence of hues has no natural order, so readers cannot tell high from low without checking the legend on every county. Use one hue, light to dark.
Yes. The outline above is a free SVG of all 21 New Jersey counties — right-click to save it, print it, or drop it into a worksheet or document. No account needed.
Sube una hoja de cálculo y publica un mapa interactivo en un par de minutos — gratis y sin tarjeta.